IELTS Line Graph Questions
Here, you will find sample single line graph IELTS questions and double or more complex line graphs questions.
A line chart is common in academic IELTS writing task 1. The line chart is also known as a line graph, in which information is represented using several points joined by straight lines. The line graph shows variation in time. Thus, you will need to show the change in time in your sentences.
Proportion of population aged 65 and over
The graph below shows the proportion of the population aged 65 and over between 1940 and 2040 in three different countries. Summarize the information by selecting and reporting the main features, and make comparisons where relevant.
Model Answer

Unemployment rates in US and Japan
The graph below shows the unemployment rates in the US and Japan between March 1993 and March 1999. Write a report for a university lecturer describing the information shown below.

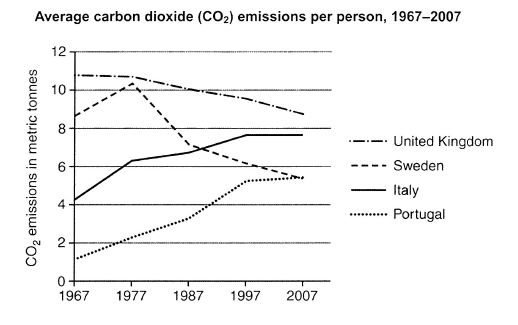
CO2 Emissions in the United KIngdom, Sweden, Italy and Portugal
The graph below shows average carbon dioxide (CO2) emissions per person in the United KIngdom, Sweden, Italy and Portugal between 1967 and 2007. Summarise the information by selecting and reporting the main features, and make comparisons where relevant.
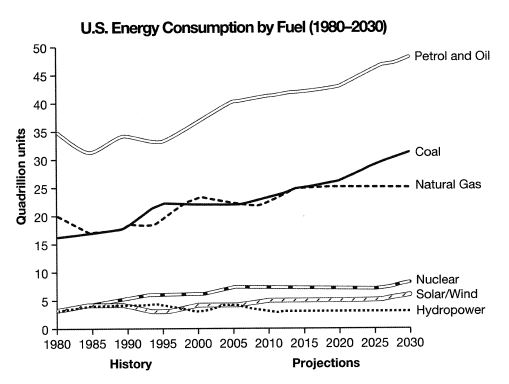
Consumption of energy in the USA since 1980 with projections
The graph below gives information from a 2008 report about consumption of energy in the USA since 1980 with projections until 2030. Summarise the information by selecting and reporting the main features, and make comparisons where relevant.
Model Answer
Fish and meat consumption in a European country
The graph below shows the consumption of fish and some different kinds of meat in a European country between 1979 and 2004. Summarise the information by selecting and reporting the main features, and make comparisons where relevant.

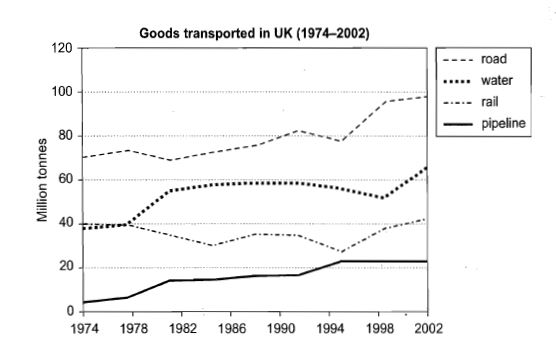
Quantities of goods transported in the UK
The graph below shows the quantities of goods transported in the UK between 1974 and 2002 by four different modes of transport. Summarise the information by selecting and reporting the main features, and make comparisons where relevant.