
The chart below shows the amount of leisure time enjoyed by men and women of different employment status. Write a report for a university lecturer describing the information shown below.
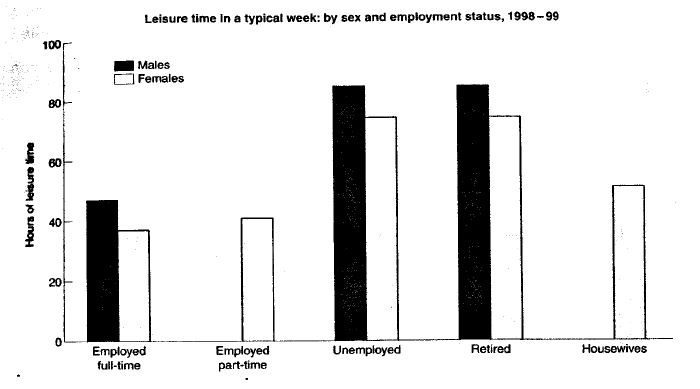
The chart illustrates how much free time both genders of various employment status enjoyed over a week in the year of 1998 to 1999. Time is given in hours.
Overall, males enjoyed more leisure time than females in the given period except for the category of employed part-time and housewives. Both unemployed and retired enjoyed for the same and highest number of hours for men and women whereas the least enjoyed hours was by the full-time employed people.
For unemployed and retired people of both genders, the number of leisure hours enjoyed was almost the same, which was around 80 hours a week for men and more than 70 hours a week for women. Both these categories enjoyed the maximum free time as compared to the other employment categories.
On the other hand, full-time employed men and women enjoyed the least amount of time (approximately 50 hours for men and 40 hours for women). There are two categories based on employment status that only belonged to women. Part-time employed women enjoyed almost 40 hours per week whereas the housewives enjoyed around 50 hours per week.
The graph below shows the proportion of the population aged 65 and over between 1940 and 2040 in three different countries. Summarize the information by selecting and reporting the main features, and make comparisons where relevant.
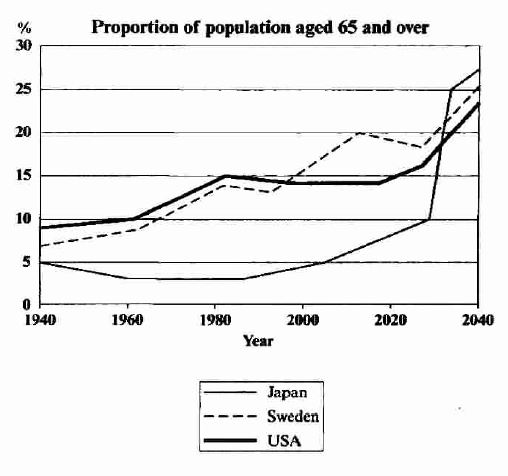
The graph depicts the 100 years data between 1940 and 2040 for three different countries (Japan, Sweden, and the USA) about the percentage of the population who are 65 years old and over.
Overall, the proportion of old-aged people will increase for all the three countries in the future. The percentage for the aged people in Japan will increase drastically and will reach at highest position followed by Sweden and the USA whereas, in the past, the least portion of old-aged people was in Japan, and the highest was in the USA.
Initially, in 1940, the measure of people aged 65 years and over was between 5% to 10% for the three countries. With time the aged population of Japan declined below 5%. On the other hand, for Sweden and the USA, it rose above 10% and reached around 15% of the total population in 1980.
Furthermore, after this, the population of senior citizens in Japan starts rising, and it is expected to increase extremely after 2020 till 2040 and will reach the highest position (above 25%). Similarly, after 2020 the old-aged population of the USA and Sweden will rise.
The diagram below shows how the Australian Bureau of Meteorology collects up-to-the-minute information on the weather in order to produce reliable forecasts.Write a report for a university lecturer describing the information shown below.
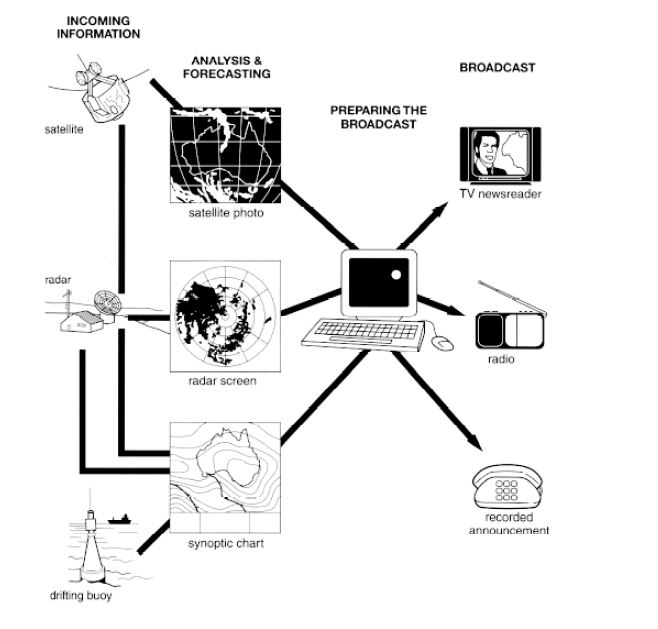
The diagram illustrates how the most recent information about the weather is collected by the Australian Bureau of Meteorology to generate reliable weather forecasts.
Overall, information collected through various instruments can be broadcasted, after it has been analyzed, forecasted, and prepared for broadcasting.
Initially, the incoming information is collected using three instruments called as satellite, radar, and drifting buoy. Satellite photo is used to visualize data collected using satellite, radar screen is available to view data collected via radar, and the data collected by a drifting buoy can be visualized using a synoptic chart.
This information is then analyzed to generate an up-to-date weather forecasting report, and it is then forecasted further so that it can be prepared for broadcasting on different mediums for the general public. After this, the final information which is in the form of weather forecasts is broadcasted among people via TV newsreader, radio, and recorded announcements.
The diagram below shows how geothermal energy is used to produce electricity. Summarise the information by selecting and reporting the main features, and make comparisons where relevant.
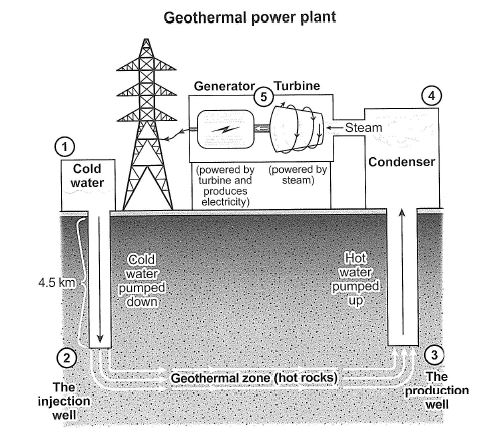
The diagram illustrates the production of electricity by using geothermal energy.
Overall, the process of generating electricity by geothermal energy consists of five stages, from converting cold water to hot water and then producing electricity with the help of a condenser, turbine, and generator.
Initially, the cold water is pumped down at 45km depth through the injection well before being passed through the geothermal zone. The geothermal zone consists of hot rocks and after passing through these rocks, the water gets heat up. At the next step, the hot water is pumped up in the condenser for further processing through the production well.
The condenser condenses the water and converts it into vapours. Then, the steam causes the turbine to rotate by passing through it. Lastly, the turbine provides power to the generator, and this produces electricity, which is sent to a power station by power lines.
The two maps below show an island, before and after the construction of some tourist facilities. Summarise the information by selecting and reporting the main features, and make comparisons where relevant.
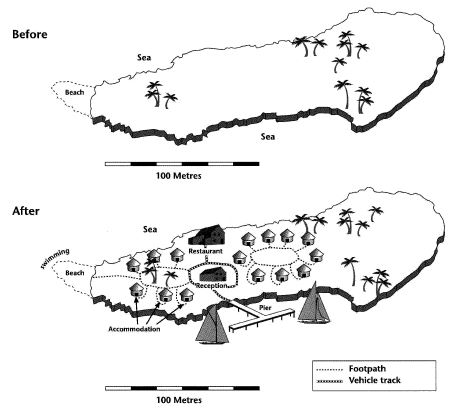
The maps illustrate a comparison of an island before and after building some facilities for travelers.
Overall, there has been considerable development all around the island. Some new facilities were built for tourists without harming the trees and other natural resources of the island. It has been analyzed that most developments took place near the beach area.
Earlier, there were trees and a beach on the island. Owing to this, most of the place on the island was empty. Significant changes have been seen after the development of some tourist facilities on the beach to facilitate visitors. These facilities include a restaurant, two accommodations on either side of the restaurant, a reception area, and a pier for boating. A swimming area was developed to provide an extra activity for the tourists.
Additionally, footpaths and vehicle tracks have been built to ease the commuting of the tourists. The walkways connected all the accommodations while the vehicle tracks connected the restaurant, reception area, and pier. The footpath also connected the accommodation on the left side of the restaurant with the beach.
The chart below shows the amount spent on six consumer goods in four European countries. Write a report for a university lecturer describing the information shown below.
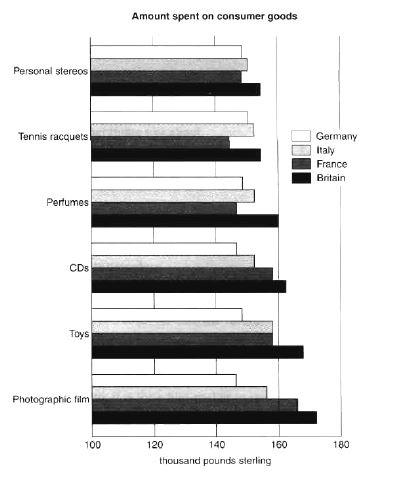
The chart illustrates the expenditure (pounds sterling) of four European countries (Germany, Italy, France, and Britain) on personal stereos, tennis racquets, perfumes, CDs, toys, and photographic film.
Overall, Britain spent more money on consumer goods as compared to other countries. On the other hand, Germany spent the least amount of money among the four countries.
In terms of photographic film, British people spent approximately £170 thousand as opposed to the European people (France, Italy, and Germany spent £165 thousand, about £156 thousand, and £145 thousand, respectively ). Both France and Italy spent the same amount of money on toys (approximately £157,000), whereas Britain and Germany spent more than £160,000 and £140,000, respectively.
Above £160,000 was spent on CDs by the Britishers, which was more than the European people (below £160,000). Apart from Britain, none of the other countries spent much money on perfumes. Neither of the countries spent much amount of money on personal stereos and tennis racquets, which is almost the same for Britain, Italy, and Germany (£155,000, £150,000, £147,000 respectively). France’s expenditure on personal stereos was £150,000, and tennis racquets were around £145,000.
The graph below gives information from a 2008 report about consumption of energy in the USA since 1980 with projections until 2030. Summarise the information by selecting and reporting the main features, and make comparisons where relevant.
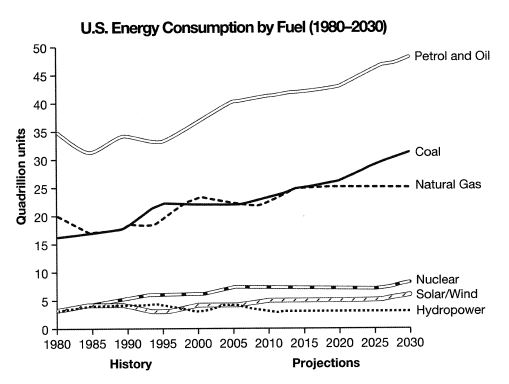
The line graph illustrates information about fuel energy consumption in the USA since 1980 with prediction until 2030 from a 2008 report. Energy is measured in quadrillion units.
Overall, petrol and oil show the highest proportion of energy consumption, whereas solar or wind energy and hydropower represent the lowest amount of energy use. Furthermore, the energy consumption using petrol and oil, coal, nuclear, and solar or wind will increase while the consumption of natural gas and hydropower will become stable.
The consumption of petrol and oil began at 35 quadrillion units in 1980 and will steadily peak at more than 45 quadrillion units until 2030. Likewise, approximately 17 quadrillion units of coal were consumed during the initial year, and this consumption will rise to near about 29 quadrillion units in the final year of the given period. Concerning natural gas, the consumption was 20 quadrillion units, which increases slightly and will become stable by reaching up about 22 quadrillion units.
Only a slight difference has been seen in the consumption of the other three sources of energy. 4 quadrillion units of nuclear and solar/wind energy were consumed in the first year and will reach at 7 and 5 quadrillion units, respectively. On the other hand, the consumption of hydropower was 4 quadrillion units and will decrease by 1 unit.
Chorleywood is a village near London whose population has increased steadily since the middle of the nineteenth century. The map below shows the development of the village. Write a report for a university lecturer describing the development of the village.
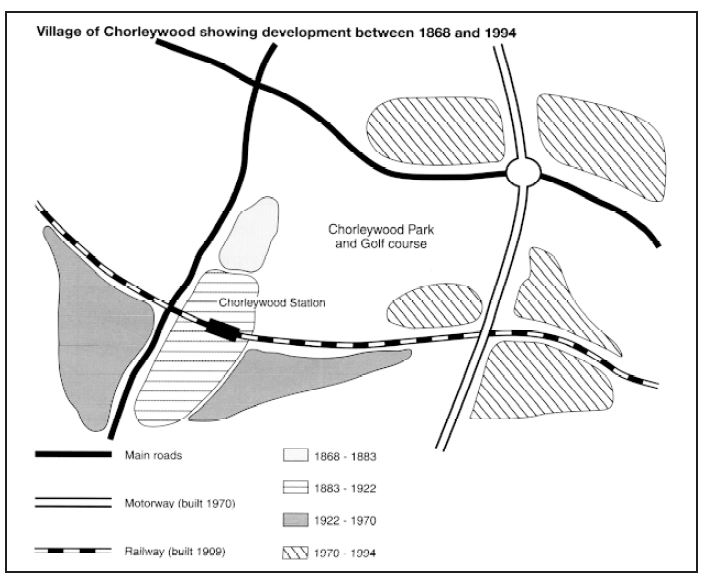
The map illustrates the development and an increase in the population of Chorleywood village (near London) from 1868 to 1994.
Overall, the progress has steadily increased in the village in the given period. Transportation facilities had also improved.
Earlier, there was a small village near to the Chorleywood Park and Golf course, which was at the center. Also, two main roads were intersecting each other. Until 1922, some more settlement areas developed adjoining to the previous residential area. There was an increase in the settlement areas from 1922 to 1970 on the left and right side of the development that occurred from 1883 to 1922. A railway line was built in 1909, and a railway station was also constructed in the area developed from 1883 to 1922.
The motorway constructed in 1970, and it crossed both the main road and railway line. A roundabout was also built at the intersection of the motorway with the main road. A major development in the settlement areas also occurred after 1970. These areas are on both sides of the motorway.
The two maps below show road access to a city hospital in 2007 and 2010. Summarise the information by selecting and reporting the main features, and make comparisons where relevant.
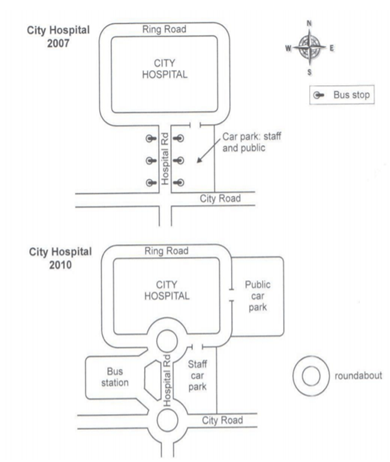
The two layouts display the access to the city hospital by road in the years 2007 and 2010.
Overall, there was only one way to reach the city hospital in both years. The access via the city road to the hospital changed in 2010. Roundabouts were also built on two different intersections. Most of the changes were done around hospital road.
In 2007, the ring road surrounded all the four sides of the city hospital, whereas the city road was on its south side and intersected with the hospital road. There were three bus stops on each side of hospital road. The parking area for staff and the public was on the east side of hospital road and had its entry from the ring road.
Road access to the city hospital underwent some changes in 2010. In the north and south side of Hospital road, two roundabouts were built. Instead of several small bus stops, a separate bus station was constructed west of hospital road, having an entrance from both roundabouts. One roundabout was built at the intersection of city and hospital road. Another was on the T-intersection of the ring road and hospital road. Moreover, the parking facility for staff remained in its position. But a new and spacious car park for the public was built on the east of the hospital, which could access via the ring road.
The table below shows the consumer durables (telephone, refrigerator, etc.) owned in Britain from 1972 to 1983. Write a report for a university lecturer describing the information shown below.
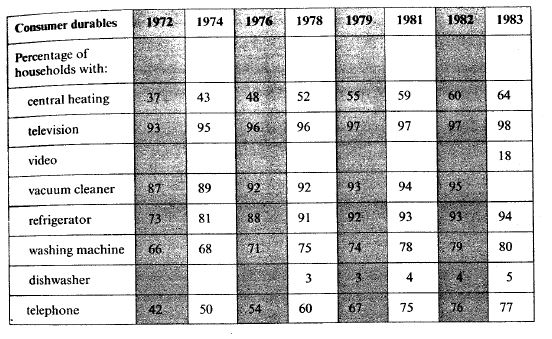
The table illustrates the percentage of British households that owned consumer durables (central heating, television, video and others) between 1972 to 1983.
Overall, the maximum number of households owned a television in the given years. Dishwashers and video were the least common consumer durables in British households.
In 1972, central heating was owned by 37% of British households. Over time, possession of central heating grew, and in 1983, 64% of British households owned central heating. Television was the most owned consumer durable in Britain. 93% of British households owned a television in the first year. Its possession grew a little in the given years. In the last year, 98% of households owned televisions. In 1972, many households (87%) owned a vacuum cleaner, and its usage increased until 1982 to 95%. In the last given year(1983), not even a single household possessed a vacuum cleaner. Refrigerator and washing machine was owned by 73 and 66 percent of households in 1972, respectively. Possession of these materials also increased throughout the given period.
In the case of telephone, 42% of households owned it in 1972, and in 1983, 77% of households owned it. Two consumer durables (dishwasher and video) were uncommon among British people. Only 18% of households owned video in the last year. People started using the dishwasher in 1978 when only 3% of households owned it, and in 1983, this value increased to 5%.
The maps below show the center of a small town called Islip as it is now, and plans for its development.
Summarise the information by selecting and reporting the main features, and make comparisons where relevant.

The current central layout and future development plan of a small town known as Islip are depicted in two maps.
Overall, it can be seen that the town will have many more facilities than now. The countryside area will be occupied by several developments. Also, the town will be surrounded by a dual carriageway.
Presently, the town has a series of shops on both sides of the main road that leads from the west to the east. Beyond the shops on the north side, there is the countryside area. The housing area is now only on the south side of the town. There is a big park on the southeast side of the town that can be accessed by a road leading from the main road.
In the future, all shops that are presently on the north of the main road will be replaced by a bus station, car park, shopping centre and new housing. The main road will be turned into a pedestrian-only path. The shops in the south will have no change. More housing facilities will be provided in this area. Where the school building will expand, the park size will be reduced. The whole town will be surrounded by a dual carriageway.
The chart below shows how frequently people in the USA ate in fast food restaurants between 2003 and 2013.
Summarise the information by selecting and reporting the main features, and make comparisons where relevant.

How often the people of the United States went to eat at fast food restaurants in 2003, 2006 and 2013 is depicted in a vertical bar chart. The data is given in percentages.
Overall, the proportion of people visiting fast-food restaurants once a week and once or twice a month was the highest. Never and every day goers were almost the same in all three years. The proportion was the same for people who went to fast food restaurants a few times a year in 2006 and 2013.
Less than 5 per cent of people were everyday goers to fast food restaurants in all three years(2003, 2006, and 2013). 20 per cent of people in 2006 went several times a week to fast food restaurants. For such people, the ratio was more than 15 per cent in 2003 and 2013. The proportion of people who ate at fast food restaurants once a week in 2006 and once or twice a month in 2013 was the same as well as the highest(well above 30 per cent). In 2003 and 2006, the proportion of people in this segment was around 25 and 30 per cent.
An equal proportion of people in 2006 and 2013 went to eat fast food at a restaurant in the United States: 15%. In 2003, five per cent of people never went to eat at fast food restaurants, whose ratio reduced to less than five per cent after three years and remained the same in 2013.
The diagram below shows how geothermal energy is used to produce electricity.
Summarise the information by selecting and reporting the main features, and make comparisons where relevant.

How geothermal energy is used to produce electricity is depicted in the given diagram.
Overall, in five stages, the electricity is produced using geothermal energy. Cold water acts as a fuel in this process. A turbine-powered generator produces electricity in the final stage.
The process of producing electricity using geothermal energy starts by storing cold water above the earth. This water is pumped 4.5km down into the earth. In the second stage, water reaches the injection well, where it is injected into the geothermal zone. Here, hot rocks heat the water, which is then reached to the third stage(production well).
In the fourth stage, water is put into a condenser. The condenser transforms the hot water into steam. The steam transfers to the fifth stage, and here, it empowers the turbine to rotate. The turbine, in turn, operates the generator. The generator is the equipment that produces electricity and transfers it to the power poles. Then, the electricity is further distributed.