
Cambridge IELTS Academic 2 Writing Task 1 Model Answers
TEST - 1
The table below shows the consumer durables (telephone, refrigerator, etc.) owned in Britain from 1972 to 1983.
Write a report for a university lecturer describing the information shown below.
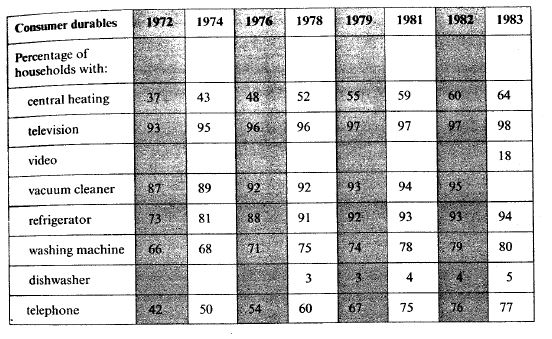
The table illustrates the percentage of British households that owned consumer durables (central heating, television, video and others) between 1972 to 1983.
Overall, the maximum number of households owned a television in the given years. Dishwashers and video were the least common consumer durables in British households.
In 1972, central heating was owned by 37% of British households. Over time, possession of central heating grew, and in 1983, 64% of British households owned central heating. Television was the most owned consumer durable in Britain. 93% of British households owned a television in the first year. Its possession grew a little in the given years. In the last year, 98% of households owned televisions. In 1972, many households (87%) owned a vacuum cleaner, and its usage increased until 1982 to 95%. In the last given year(1983), not even a single household possessed a vacuum cleaner. Refrigerator and washing machine was owned by 73 and 66 percent of households in 1972, respectively. Possession of these materials also increased throughout the given period.
In the case of telephone, 42% of households owned it in 1972, and in 1983, 77% of households owned it. Two consumer durables (dishwasher and video) were uncommon among British people. Only 18% of households owned video in the last year. People started using the dishwasher in 1978 when only 3% of households owned it, and in 1983, this value increased to 5%.
TEST - 2
The chart below shows the amount of leisure time enjoyed by men and women of different employment status.
Write a report for a university lecturer describing the information shown below.
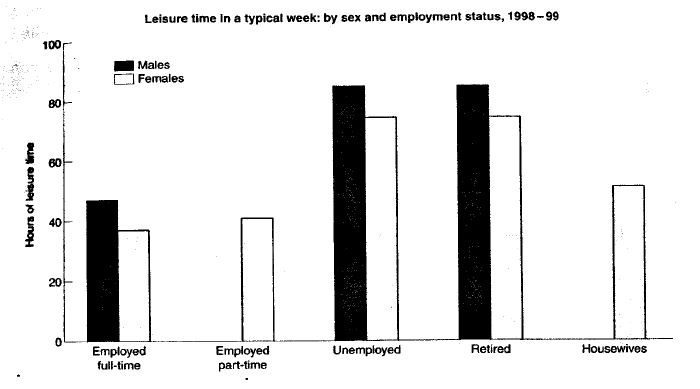
The chart illustrates how much free time both genders of various employment status enjoyed over a week in the year of 1998 to 1999. Time is given in hours.
Overall, males enjoyed more leisure time than females in the given period except for the category of employed part-time and housewives. Both unemployed and retired enjoyed for the same and highest number of hours for men and women whereas the least enjoyed hours was by the full-time employed people.
For unemployed and retired people of both genders, the number of leisure hours enjoyed was almost the same, which was around 80 hours a week for men and more than 70 hours a week for women. Both these categories enjoyed the maximum free time as compared to the other employment categories.
On the other hand, full-time employed men and women enjoyed the least amount of time (approximately 50 hours for men and 40 hours for women). There are two categories based on employment status that only belonged to women. Part-time employed women enjoyed almost 40 hours per week whereas the housewives enjoyed around 50 hours per week.