
Cambridge IELTS Academic 17 Writing Task 1 Model Answers
Test - 1
The maps show an industrial area in the town of Norbiton, and planned future development of the site. Summarise the information by selecting and reporting the main features, and make comparisons where relevant.

The present layout of an industrial area in the town of Norbiton and its future development plan are shown in two maps.
Overall, the industrial area will be completely occupied by houses, and no factories will remain. Farmland to the north of the river will be connected to the industrial area. A playground, a school, shops, and other new facilities will be introduced.
Presently, there is a roundabout in the center of the industrial area, from which a road extends eastward. Along this road, factories are situated on both sides, with one factory located at its dead end. Another road from the roundabout leads south and forms a T-junction with a road that runs from east to west. A river lies to the north, and beyond it is farmland. The town is located to the east of the industrial area.
As per the future development plan, there will be no factories in the industrial area. The factories along the eastbound road will be replaced by houses, and instead of a factory at its end, a school will be built. A subway will connect this road to a playground in the north. Farmland will be linked to the central roundabout by constructing a bridge over the river, and additional houses will be built in the farmland. A medical center and some shops will be located in the southeast and southwest of the roundabout, respectively. Another road will extend northwest, with houses at its end and to its north. A small roundabout will be constructed at the current T-junction of the southbound road and the east-west road.
Test - 2
The table and charts give information on the police budget for 2017 and 2018 in one area of Britain. The Table shows where the money came from and the charts show how it was distributed. Summarise the information by selecting and reporting the main features, and make comparisons where relevant.
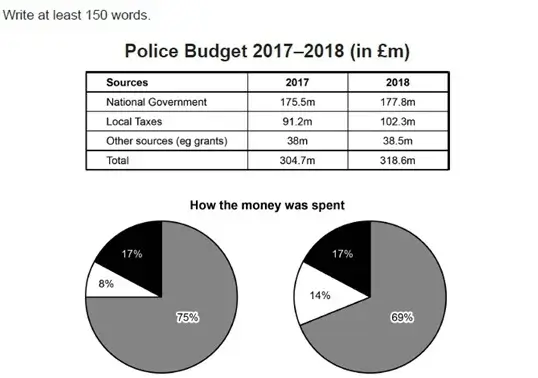
The police budget for one area of Britain in 2017 and 2018 is shown in a table and two pie charts. The table displays the sources of income, while the pie charts illustrate how the money was spent.
Overall, the police department had a higher income in 2018 than in 2017, with the majority of funding coming from the national government in both years. The largest proportion of expenditure was allocated to officers’ and staff salaries in both years. However, spending on technology increased in 2018 compared to 2017.
In 2017, the police department received pounds 175.5 million from the national government, which increased slightly to £177.8 million in 2018. Local taxes were the second-largest source of income, contributing pounds 91.2 million in 2017 and rising to £102.3 million the following year. Other sources, such as grants, provided £38 million in 2017 and £38.5 million in 2018.
On the expenditure side, 75% of the total budget was allocated to officers’ and staff salaries in 2017, which decreased to 69% in 2018. Spending on buildings and transport remained unchanged at 17% in both years. In contrast, expenditure on technology rose from 8% in 2017 to 14% in 2018.
Test - 3
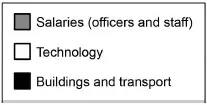
The chart gives information about how families in one country spent their weekly income in 1968 and in 2018. Summarise the information by selecting and reporting the main features, and make comparisons where relevant.
A horizontal bar chart presents data on the distribution of weekly spending by households in a particular country in the years 1968 and 2018.
Overall, it can be clearly seen that spending on food was almost twice as high in 1968 as in 2018. Expenditure on household goods remained the same in both years, while average weekly spending on leisure more than doubled over the five decades.
In 1968, the highest proportion of weekly income—35 percent—was spent on food, but this figure dropped to less than 20 percent by 2018. In contrast, the trend was reversed for housing: only 10 percent of income was allocated to it in 1968, rising to nearly 20 percent in 2018. Average weekly spending on fuel and power, as well as clothing and footwear, was below 5 percent and exactly 5 percent, respectively, in 2018. However, in 1968, spending on these categories was above 5 percent and 10 percent, respectively.
Expenditures on household goods, personal goods, and transport were the same in 1968, which were below ten percent of weekly income. By 2018, spending on household goods remained unchanged, while expenditure on personal goods decreased to less than 5 percent. In contrast, spending on transport rose to approximately 15 percent of weekly income. Leisure activities accounted for the highest spending in 2018—over 20 percent—compared to less than 10 percent five decades earlier.
Test - 4
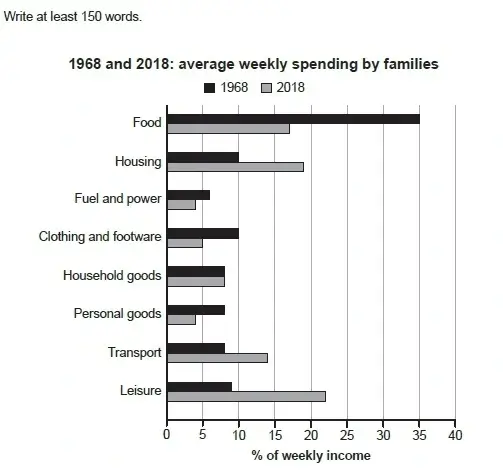
The graph shows the number of shops that closed and the number of new shops that opened in one country between 2011 and 2018. Summarise the information by selecting and reporting the main features, and make comparisons where relevant.
Between 2011 and 2018, the line graph illustrates the number of shop closures and new shop openings in a particular country.
Overall, the highest number of shops opened was at the beginning of the given period, while this figure dropped to the lowest point in 2018. The fewest shop closures occurred in 2015. In 2014, the number of shops that opened and closed was almost the same.
In 2011, the highest number of shops was opened, reaching 8,000, while fewer than 7,000 shops were closed. In the following year (2012), the number of new shop openings plummeted to below 4,000, and shop closures also declined to 6,000. By 2014, the number of shops that opened and closed was nearly the same, at just over 6,000.
The number of shop closures plunged to below 1,000 in 2015, while 4,000 new shops opened in the same year. The number of shop openings remained relatively stable until 2017 but dropped to 3,000 in 2018. In contrast, shop closures rose sharply again in 2016 to over 5,000 and remained at a similar level until the end of the given period.