
Cambridge IELTS Academic 13 Writing Task 1 Model Answers
TEST - 1
The two maps below show road access to a city hospital in 2007 and 2010. Summarise the information by selecting and reporting the main features, and make comparisons where relevant.
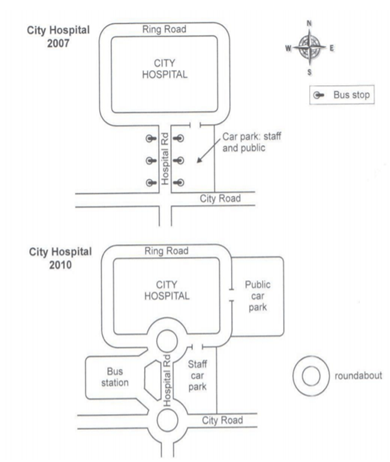
The two layouts display the access to the city hospital by road in the years 2007 and 2010.
Overall, there was only one way to reach the city hospital in both years. The access via the city road to the hospital changed in 2010. Roundabouts were also built on two different intersections. Most of the changes were done around hospital road.
In 2007, the ring road surrounded all the four sides of the city hospital, whereas the city road was on its south side and intersected with the hospital road. There were three bus stops on each side of hospital road. The parking area for staff and the public was on the east side of hospital road and had its entry from the ring road.
Road access to the city hospital underwent some changes in 2010. In the north and south side of Hospital road, two roundabouts were built. Instead of several small bus stops, a separate bus station was constructed west of hospital road, having an entrance from both roundabouts. One roundabout was built at the intersection of city and hospital road. Another was on the T-intersection of the ring road and hospital road. Moreover, the parking facility for staff remained in its position. But a new and spacious car park for the public was built on the east of the hospital, which could access via the ring road.
TEST - 2
The chart below shows the percentage of households in owned and rented accommodation in England and Wales between 1918 and 2011.
Summarise the information by selecting and reporting the main features, and make comparisons where relevant.

The proportion of households living in owned and rented houses in England and Wales from 1918 to 2011 is depicted in a bar chart.
Overall, the percentage of households in England and Wales living in rented accommodation decreased over the decades while people staying in own properties increased. The proportion of rented and owned households was the same in 1971. Households living in rented accommodation were the highest in 1918.
In 1918, households living in their own accommodation were the lowest(around 20%), but those living in rented properties were the highest(70%). People living on rent started declining and were less than 70% in 1939 and 1953. On the other hand, property ownership started increasing and reached more than 40 per cent in 1961. The proportion of households living in rented and owned accommodation was the same (50% each) in the year 1971.
After 1971, owned households surpassed the proportion of rented households. But their ratio remained between 60 to 70 per cent until 2011. The proportion of rented households in England and Wales declined to its lowest proportion of around 30% till 2001 but again increased to nearly 40 per cent in 2011.
TEST - 3
The bar chart below shows the top ten countries for the production and consumption of electricity in 2014.
Summarise the information by selecting and reporting the main features, and make comparisons where relevant.

The top ten electricity producers and consumer countries in 2014 are depicted in a horizontal bar chart.
Overall, China was the top consumer and producer of electricity, followed by the United States. The production and consumption of electricity in Russia were almost the same. Germany was the only country that utilised more electricity than its generation.
In 2014, 5,398 billion kWh of electricity was produced, while 5,322 billion kWh of electricity was consumed in China. The United States utilised and generated 3,866 and 4,099 billion kWh of electricity, respectively. Russia was far behind China and the United States in electricity generation and consumption. It produced 1,057 billion kWh of electricity and consumed 1,038 billion kWh. The consumption and production of electricity were less in Japan and India than in Russia. Canada produced 618.9 billion kWh and 499.9 billion kWh of electricity.
France and Brazil’s consumption of electricity was almost the same: 462.9 and 455.8, respectively. Their production was also nearly equal(561.2 billion kWh in France and 530.7 billion kWh in Brazil). Germany produced less(526.6 billion kWh) electricity than consumed(582.5 billion kWh). The Korean Republic was in the 10th position for electricity production(485.1 billion kWh) and consumption(449.5 billion kWh).
TEST - 4
The plans below show the layout of a university's sports centre now, and how it will look after redevelopment.
Summarise the information by selecting and reporting the main features, and make comparisons where relevant.

The future plans and present layout of a university’s sports centre are depicted in two maps.
Overall, the university sports centre will have many more facilities in the future than now. The gym area will be expanded, and the outside courts will covered in the building premises. A new leisure poll will also be built.
The university sports centre now has a 25-meter-long pool north of the reception. The pool has a seating area in the east and a changing room in the west. On the north-most side of the sports centre, there is a gym. The gym area will expand towards the east in the future. There are two outdoor courts on the east and west sides of the sports centre. The eastern outdoor court will be replaced by a sports hall and two dance studios, while the leisure pool will occupy the western outdoor court.
Two changing rooms will be built on the south-east and south-west side of the sports centre. A cafe and sports shop will be on the east and west sides of the entrance, respectively. The reception and the 25m pool will have no change in the future.