
Cambridge IELTS Academic 5 Writing Task 1 Model Answers
TEST - 1
The graph below shows the proportion of the population aged 65 and over between 1940 and 2040 in three different countries.
Summarize the information by selecting and reporting the main features, and make comparisons where relevant.
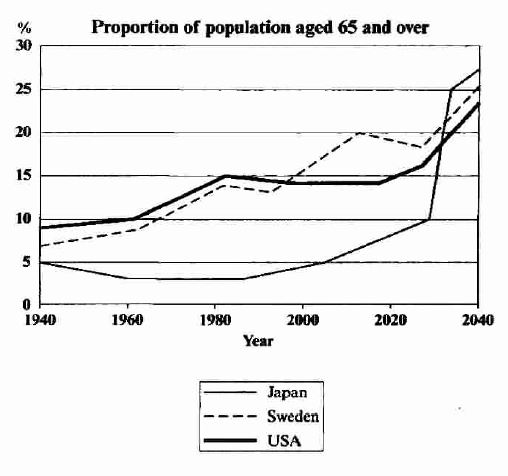
The graph depicts the 100 years data between 1940 and 2040 for three different countries (Japan, Sweden, and the USA) about the percentage of the population who are 65 years old and over.
Overall, the proportion of old-aged people will increase for all the three countries in the future. The percentage for the aged people in Japan will increase drastically and will reach at highest position followed by Sweden and the USA whereas, in the past, the least portion of old-aged people was in Japan, and the highest was in the USA.
Initially, in 1940, the measure of people aged 65 years and over was between 5% to 10% for the three countries. With time the aged population of Japan declined below 5%. On the other hand, for Sweden and the USA, it rose above 10% and reached around 15% of the total population in 1980.
Furthermore, after this, the population of senior citizens in Japan starts rising, and it is expected to increase extremely after 2020 till 2040 and will reach the highest position (above 25%). Similarly, after 2020 the old-aged population of the USA and Sweden will rise.