
Cambridge IELTS Academic 9 Writing Task 1 Model Answers
TEST - 1
The two maps below show an island, before and after the construction of some tourist facilities.
Summarise the information by selecting and reporting the main features, and make comparisons where relevant.
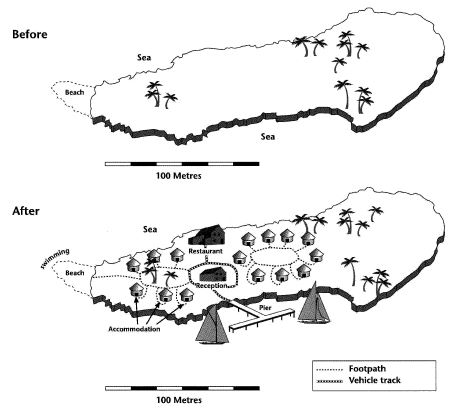
The maps illustrate a comparison of an island before and after building some facilities for travelers.
Overall, there has been considerable development all around the island. Some new facilities were built for tourists without harming the trees and other natural resources of the island. It has been analyzed that most developments took place near the beach area.
Earlier, there were trees and a beach on the island. Owing to this, most of the place on the island was empty. Significant changes have been seen after the development of some tourist facilities on the beach to facilitate visitors. These facilities include a restaurant, two accommodations on either side of the restaurant, a reception area, and a pier for boating. A swimming area was developed to provide an extra activity for the tourists.
Additionally, footpaths and vehicle tracks have been built to ease the commuting of the tourists. The walkways connected all the accommodations while the vehicle tracks connected the restaurant, reception area, and pier. The footpath also connected the accommodation on the left side of the restaurant with the beach.
TEST - 4
The graph below gives information from a 2008 report about consumption of energy in the USA since 1980 with projections until 2030.
Summarise the information by selecting and reporting the main features, and make comparisons where relevant.
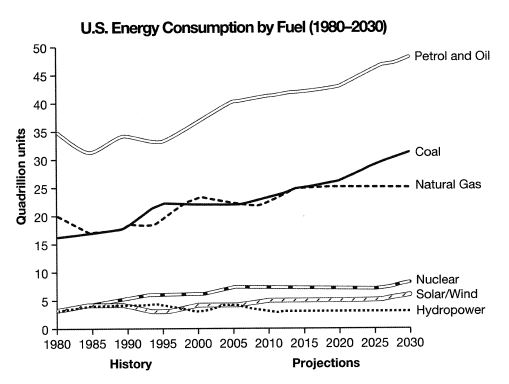
The line graph illustrates information about fuel energy consumption in the USA since 1980 with prediction until 2030 from a 2008 report. Energy is measured in quadrillion units.
Overall, petrol and oil show the highest proportion of energy consumption, whereas solar or wind energy and hydropower represent the lowest amount of energy use. Furthermore, the energy consumption using petrol and oil, coal, nuclear, and solar or wind will increase while the consumption of natural gas and hydropower will become stable.
The consumption of petrol and oil began at 35 quadrillion units in 1980 and will steadily peak at more than 45 quadrillion units until 2030. Likewise, approximately 17 quadrillion units of coal were consumed during the initial year, and this consumption will rise to near about 29 quadrillion units in the final year of the given period. Concerning natural gas, the consumption was 20 quadrillion units, which increases slightly and will become stable by reaching up about 22 quadrillion units.
Only a slight difference has been seen in the consumption of the other three sources of energy. 4 quadrillion units of nuclear and solar/wind energy were consumed in the first year and will reach at 7 and 5 quadrillion units, respectively. On the other hand, the consumption of hydropower was 4 quadrillion units and will decrease by 1 unit.